Simons Foundation
chevron-down--small
Program Areas
Mathematics & Physical Sciences
Life Sciences
Autism Research Initiative
Neuroscience
Simons Collaborations
Flatiron Institute
Science, Society & Culture
Multidisciplinary Programs
Funding
Funding Opportunities
Policies and Procedures
Award Instructions
Simons Award Manager (SAM) FAQs and Videos
News
Announcements
Articles
Videos
What We’re Reading
Events
Presidential Lectures
Presents
About
About Us
Annual Report
Leadership
Our History
Media Relations
Careers
Summer at Simons
Visitor Information
Contact Us
SFARI
chevron-down--small
SFARI
Funding
Funding Opportunities
SFARI Scientific Perspectives
Fellows-to-Faculty
Conferences and Courses Awards
Grant Policies and Procedures
Simons Award Manager (SAM) FAQs and Videos
Acknowledgment Policy
Sign Up for RFA Announcements
Resources
Autism Cohorts
Autism Inpatient Collection
Simons Searchlight
Simons Simplex Collection
SPARK
Models
iPS cell models
Mouse models
Rat models
Zebrafish models
Other Resources
Autism BrainNet
Research Match
SFARI Base
SFARI Gene
Data analysis tools
Simons Sleep Project
Research
SFARI Investigators
Funded Projects
Autism Rat Models Consortium
Funded Centers
Funded Publications
Research Highlights
News
SFARI News
SFARI Conversations
Workshop and Meeting Reports
Newsletter Archive
Events
All Events
Lectures
Webinars
SFARI Socials
About
About SFARI
Letter from Leadership
Contact Us
Career Opportunities
Our Team
Advisors
SFARI Scientific Advisory Board
SFARI Scientific Review Board
Tag: genome-wide association study
All (12)
News (6)
Projects (5)
Events (1)
March 06, 2023
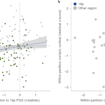
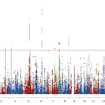
A new approach to analyzing genomic association data finds convergence of both rare and common genetic influences on autism at chromosome 16p
By Azra Jaferi
May 09, 2022
Characterizing the convergent molecular mechanisms of common and rare autism-associated genetic variation
December 01, 2020
Defining the regulatory landscape of autism susceptibility genes in human neurons
April 29, 2020
Progress in understanding the genetic basis of mental health
May 30, 2019
SFARI fall 2018 science meeting highlighted recent findings in autism research
By Serena Bianchi
March 19, 2019
Largest genome-wide association study yields common variants associated with risk of autism
Previous Page
Viewing
Page
1 of 2
Page
2 of 2
Page
1 of 2
Page
2 of 2
Next Page
Subscribe to our newsletter and receive SFARI funding announcements and news
Continue
Funding
Funding
Funding Opportunities
SFARI Scientific Perspectives
Fellows-to-Faculty
Conferences and Courses Awards
Grant Policies and Procedures
Simons Award Manager (SAM) FAQs and Videos
Acknowledgment Policy
Sign Up for RFA Announcements
Resources
Resources
Resources
Autism Cohorts
Autism Cohorts
Autism Inpatient Collection
Simons Searchlight
Simons Simplex Collection
SPARK
Models
Models
iPS cell models
Mouse models
Rat models
Zebrafish models
Other Resources
Other Resources
Autism BrainNet
Research Match
SFARI Base
SFARI Gene
Data analysis tools
Simons Sleep Project
Research
Research
SFARI Investigators
Funded Projects
Autism Rat Models Consortium
Funded Centers
Funded Publications
Research Highlights
News
News
SFARI News
SFARI Conversations
Workshop and Meeting Reports
Newsletter Archive
Events
Events
All Events
Lectures
Webinars
SFARI Socials
About
About
About
About SFARI
Letter from Leadership
Contact Us
Career Opportunities
Our Team
Advisors
Advisors
SFARI Scientific Advisory Board
SFARI Scientific Review Board